Waveform Distortions And Measurement Methods
I. VIDEO AMPLITUDE AND TIME MEASUREMENTS
This section deals with two fundamental properties of the signal, amplitude and time. In these two dimensions, problems are more frequently caused by operator error than by malfunctioning equipment. Correction of amplitude and pulse width problems often simply involves proper adjustment of the equipment
the signal passes through.
Two kinds of amplitude measurements are important in television systems. Absolute levels, such as peak-to-peak amplitude, need to be properly adjusted.
The relationships between the parts of the signal are also important. The ratio of sync to the rest of the signal, for example, must be accurately maintained.
When setting video amplitudes, it is not sufficient to simply adjust the output level of the final piece of equipment in the signal path. Every piece of equipment should be adjusted to appropriately transfer the signal
from input to output. Television equipment is generally not designed to handle signals that deviate much from the nominal 1-volt peak-to-peak amplitude.
Signals which are too large can be clipped or distorted and signals which are too small will suffer from degraded signal-tonoise performance.
Video amplitudes are monitored and adjusted on a daily basis in most television facilities. Signal timing parameters are usually checked less fre q u e n t l y, however, it is still important to under - stand the measurement methods.
A periodic verification that all timing parameters are within limits is recommended.
This booklet does not address system timing issues which deal with relative time relationships between the many signals in a television facility. Although system timing is critical to production quality, it is outside the
scope of this publication. On the following pages, only those timing measurements that relate to a single signal are addressed.
Amplitude Measurements
DEFINITION
PAL composite video signals are nominally 1 volt peak-to-peak. Amplitude measurement techniques are used to verify that the signals conform to this nominal value and to make the appropriate gain adjustments
when needed. Similar methods of evaluating the waveform are used for both measurement and adjustment of signal levels. Measurements of the peak-topeak amplitude of the video signal are sometimes called “insertion gain” measurements.
PICTURE EFFECTS
Insertion gain errors cause the picture to appear too light or too dark. Because of the effects of ambient light, apparent colour saturation is also affected.
TEST SIGNAL
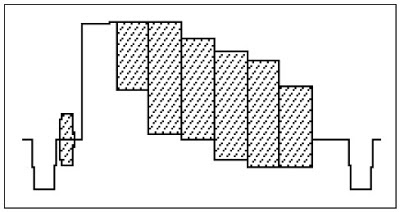
Insertion gain can be measured with any signal that contains a 700 mV white portion. Colour bars and pulse and bar signals are most frequently used (see Figures 5 and 6). Many of the standard ITS signals also contain a 700 mV bar and can be used to measure or adjust video gain.
MEASUREMENT METHODS
Waveform Monitor Graticule. Signal amplitude can be measured with a waveform monitor by comparing
the waveform to the vertical scale on the graticule. With the waveform monitor vertical gain in the calibrated setting (1 volt full scale), the signal should be 1 volt from sync tip to peak white (see Figure 7). The graticule in the VM700T WAVEFORM mode can be used in a similar manner.
Added Calibrator Method
Some waveform monitors have a feature that allows the internal calibrator signal to be used as a reference
for amplitude measurements.
This feature is known as WFM + CAL in the 1781R. In the 1481 it is accessed by depressing both the CAL button and the OPER buttons.
The WFM + CAL display consists of two video traces vertically offset by the calibrator amplitude.
This display is obtained by adding the incoming signal to a calibrated square wave of known amplitude. Signal amplitude is equal to the calibrator amplitude when the bottom of the upper trace and the top of the lower trace coincide.
The WFM + CAL mode is most commonly used to set insertion gain which requires a 1-volt calibrator signal. When using a 1781R, select a calibrator amplitude of 1000 mV. In the 1481R, the DC RESTORER setting determines which of two calibrator amplitudes is selected. The calibrator amplitude is 1 volt when
SYNC TIP is selected and 700 mV when BACK PORCH is selected.

 I n s e rtion gain is set by extern a l l y adjusting the signal amplitude until sync tip of the upper trace
and peak white of the lower trace coincide. Figure 8 shows a properly adjusted signal. Since the waveform monitor vertical gain need not be calibrated in this mode, the gain can be increased for greater resolution.
The 1781R has a variable amplitude calibrator so the WFM + CAL mode can be used to measure signal amplitudes other than 1 volt. Measurements are made by adjusting the calibrator amplitude (with the large front panel knob) until the bottom of the upper trace and the top of the lower trace coincide. At this
point the calibrator amplitude equals the signal amplitude and can be read from the screen. The example in Figure 9 shows the WFM + CAL mode being used to measure sync amplitude.
1781R Voltage Cursors.
Some waveform monitors, such as the 1781R, are equipped with ons c reen voltage cursors for making
accurate amplitude measurements.
Peak-to-peak amplitudecan be measured by positioning one cursor on sync tip and the other on peak white (see Figure 10). The 1781R vertical gain control affects the cursors and the waveform in the same manner so vertical gain can be increased to allow for more a c c urate positioning of the cursors.
When setting insertion gain, it may be convenient to first setthe cursor separation for 1000 mV. The video signal amplitude should than be adjusted to match the cursor amplitude.
VM700T Cursors.
Manual amplitude measurements can be made with the VM700T by selecting CURSORS in the WAVEFORM mode. The horizontal baseline in the middle of the screen is used as a reference. To measure peakto- peak amplitude, first position sync tip on the baseline. Touch the RESET DIFFS selection on
the screen to reset the voltage difference to zero. Now move the waveform down until the white bar is on the baseline and read the voltage difference from the screen.
NOTES
1. Sync to Picture Ratio. When the signal amplitude is wrong, it isimportant to verify that the problem is really a simple gain error rather than a distortion. This can be accomplished by checking the ratio of sync to the picture signal (the part of the signal above blanking), which should be 3:7.
If the ratio is cor rect, proceed with the gain adjustment. If the ratio is incorrect, there is a problem and further investigation is needed. The signal could be suffering from distortion, or equipment that re-inserts sync
and burst may be malfunctioning.
2. Sync & Burst Measurements.
Sync and burst should each be 30% of the composite video amplitude (300 millivolts for a 1-volt signal). Most of the methods discussed in this section can be used to measure sync and burst amplitudes. When using the 1781R voltage cursors, the TRACK mode is a convenient tool for comparing sync and burst amplitudes. In this mode, the separation between the two cursors remains fixed and they can be moved together with respect to the waveform.
3. Measurement Accuracy
In general, the added calibrator and voltage cursor methods are more accurate than the graticule technique.
However, some cursor implementations have far more resolution than accuracy, cre a t i n g an impression of measurements more precise than they really are. Familiarity with the specifications of the waveform monitor
and an understanding of theaccuracy and resolution available in the various modes will help make an appropriate choice.
4. Using the Luminance Filter.
When setting insertion gain with a live signal rather than a test signal, it may be useful to enable the luminance or lowpass filter on the waveform monitor. This filter removes the chrominance information so that peak white luminance levels can be used for setting gain.


Time Measurements
DEFINITION
Horizontal and vertical synchronization pulse widths are measured in order to verify that they fall within specified limits. Other synchronization parameters such as rise and fall times and the position and number of
cycles in burst are also specified and should occasionally be measured to verify compliance.
CCIR Report 624 is a widely accepted standard for PAL timing values and tolerances.
The CCIR horizontal timing information for PAL systems is reproduced in Figure 11.
PICTURE EFFECTS
Small errors in pulse widths will not affect picture quality.
However, if the errors become so large that the pulses cannot be properly processed (by equipment), picture breakup may occur.
TEST SIGNAL
Timing measurements can be made on any composite signal that contains horizontal, vertical and subcarrier (burst) synchronization information.
MEASUREMENT METHODS
Waveform Monitor Graticule.
Time intervals can be measured by comparing the waveform to the marks along the horizontal baseline of a waveform monitor graticule. In order to get adequate resolution, it is usually necessary to magnify the waveform display horizontally. Select the setting that provides as much magnification as possible while still keeping the interval of interest entirely on-screen. The scale factor, typically microseconds per major Division, changes with horizontal magnification. The 1781R displays the microseconds per division setting on the screen. For the 1481, time per division is obtained from the switch setting.
 Most PAL pulse width measurements are specified between the 50% points of the rising and falling edges. Such measurements can usually be made with the vertical gain in the calibrated position. To measure horizontal sync width, for example, positionthe waveform so that the sync pulse is centered around the graticule baseline (blanking level at 150 mV above the baseline and sync tip at 150 mV below the baseline). The time scale is now at the 50% level and the pulse width can be read directly f rom the graticule (see
F i g u re 12).
1781R Time Cursors.
Some waveform monitors and oscilloscopes are equipped with cursors to facilitate the measurement of time intervals. The time cursors in the 1781R appear as bright dots on the waveform, an implementation that allows for very accurate positioning on waveform transitions.To make a pulse width measurement, position the cursors on the 50% points of the transitions and read the cursor separation directly from the screen. An
example of a horizontal sync width measurement is shown in Figure 13. If necessary, use the vertical graticule scale to help locate the 50% points.
Alternatively, the voltage cursors in the RELATIVE mode can be used to locate the 50% points.
VM700T Cursors.
The cursors in the VM700T WAVEFORM mode can be used to make pulse width measurements. After establishing the 100% and 0% points of sync, the cursors can be moved to the 50% point to obtain a
time measurement (see Figure 14). Consult the manual for detailed instructions on how to use the cursors.


 VM700T Automatic Measurement.
The H TIMING selection in the VM700T MEASURE menu displays all horizontal blanking interval timing measurements (see Figure 15). The AUTO mode also provides measurements of the individual parameters.
NOTES
5. Rise and Fall Time Measurements.
Many standards include specifications for the rise and fall time of the sync pulse (also referred to as buildup
time). These measurements are indicators of how fast the transitions occur and are typically made between the 10% and 90% points of the signal.
The methods used for measuring pulse widths can generally be applied to rise and fall times. However, for 10%-to-90% measurements, it is generally most convenient to use the waveform monitor variable gain control to normalize the pulse height to 500 or 1000 mV. The 10% and 90% points can then easily be
located with the graticule. In the 1781R RELATIVE mode, the voltage cursors can be used to locate the appropriate levels.
6. Checking the Vertical Interval.
The number of pulses in the vertical interval, as well as the widths of the equalizing pulses and vertical serrations, are also specified. CCIR nominal values and tolerances are shown in Figure 17. It is good practice to occasionally verify that all of these parameters are correct. The V Blank selection in the VM700T
MEASURE mode provides a convenient means of checking the format of the vertical interval and the timing of the individual pulses (see Figure 16).


follows: “The subcarrier-to-line sync (Sc-H) phase is defined as the phase of the +E’u component of the colour burst extrapolated to the half-amplitude point of the leading edge of the synchronizing pulse of line 1 of field 1.” Since there is no burst on line 1, measurement of SCH phase on line 7 of field 1 has become the
generally accepted convention. Target tolerances of ± 20 degrees have been established although, in practice, much tighter tolerances are generally maintained.
Modern facilities often try to ensure that SCH phase errors do not exceed a few degrees.
PICTURE EFFECTS
SCH phase becomes important only when television signals from two or more sources are combined or sequentially switched. In order to ensure that horizontal jumps do not occur when a switch is made, the sync
edges of the two signals must be accurately timed and the phase of colour burst matched. Since both sync and subcarrier are continuous signals with a fixed relationship to one another, it is possible to simultaneously
achieve both timing conditions only if the two signals have the same SCH phase relationship.
Because of the complex relationship between the sync and subcarrier frequencies, the exact SCH phase relationship for a given line repeats itself only once every eight fields (see Note 7). In order to achieve the sync and burst timing conditions required for a clean switch between two signals, the eightfield sequence of the signals must be properly lined up (i.e. Field 1 of Signal A and Field 1 of Signal B must occur at the
same time). When this condition is achieved, the two signals are said to be ""colour framed''. It is important to remember that colour framing is inextricably tied to other system timing parameters and is by no means an
independent variable. Only if two signals have the same SCH phase relationship and are properly colour framed can the sync timing and burst phase matching requirements be achieved.
Since signals must have the same SCH phase relationship in order to be cleanly combined, standardization on one value of SCH phase will clearly facilitate the transfer of programme material.
This is one reason for trying to maintain 0 degrees of SCH phase error. Another motivation for keeping SCH phase within reasonable limits is that various pieces of equipment need to be able to distinguish between the
colour frames in order to process the signal properly. This cannot be done accurately if the SCH
phase is allowed to approach 90 degrees.
TEST SIGNALS
SCH phase measurements can be made on any signal with both sync and colour burst present.
MEASUREMENT METHODS
Polar Display. Some instruments, such as the 1781R, are equipped with a polar SCH display that consists of the two burst vectors and a dot representing the phase of sync. The dot is in the centre of a "window'' in the large circle that appears as part of the display (see Figure 18). This circle is a result of the 25 Hertz offset
(see Note 7) which changes the SCH phase from line to line. The circle itself contains no relevant information. The SCH phase is 0 degrees when the dot is at an angle midway between the two bursts. If
there is an SCH phase error, its magnitude can be determined by measuring the angle between the sync dot and the midway point of the two bursts. The graticule can be used for this purpose when the bursts are properly positioned on their +135 and -135 degree points. The precision phase shifter in the 1781R can also be used to quantify the error.
The 1781R must be internally referenced to measure the SCH phase of a single signal. Sync and burst of the selected signal are compared to each other in this mode. When external reference is selected, both burst and
sync of the selected signal are displayed relative to burst of the external reference signal. This display allows determination of whether or not two signals are colour framed. Assuming that both the reference signal and the selected signal have no SCH phase error, the sync dot will be between the burst vectors if the signals are colour framed and 180 degrees away when they are not.
VM700T Automatic Measurement.
Select SCH PHASE in the VM700T MEASURE menu to obtain a polar display of SCH phase (see Figure 19). The vector in this display directly repr esents SCH phase error (there are not separate vector representations of sync and burst). The dual SCH display provides a simultaneous view of the SCH vectors for two signals. The full field SCH display provides a field-rate display that plots the SCH phase of each line in the field.

NOTES
7. The PAL Eight-Field Sequence.
The eight-field sequence exists in PAL because of the relationships between the line, field and subcarrier frequencies.
Remember that subcarrier and H sync can be thought of as two continuous signals with a fixed relationship to one another.
This relationship is defined mathematically as: Fs c = (1135/4 X Fh) + 25 which yields a subcarrier frequency (Fsc) of 4,433,618.75 Hz for a line frequency (Fh) of 15,625 Hz. It can be seen from the equation that there are an odd number of subcarrier quarter-cycles in a line. This implies that SCH phase changes by 90 degrees every line.
Since there are also an odd number of lines in a frame, the exact phase relationship between sync and burst for a given line repeats only once every eight fields (four frames).
Due to the 25 Hz offset, which is added to interleave chrominance dot patterns in the picture, the line-to-line change in SCH phase is actually somewhat more than 90 degrees. Keep this in mind when making measurements, as this is why SCH phase is defined on a given line in PAL. It is i m p o rtant to remember, however, that the existence of the eightfield sequence is determined only by the sync-to-subcarrier relationship and is independent of the 25 Hertz offset, the Bruch blanking sequence, and the alternate-line V-axis inversion.
8. For More Information.
For a comprehensive discussion of SCH phase and colour framing issues, see Tektronix Application Note (20W-5614-1), “Measuring and Monitoring SCH Phase with the 1751A Waveform/Vector Monitor”
Lihat juga
Table of Contents
I. VIDEO AMPLITUDE AND TIME MEASUREMENTS
This section deals with two fundamental properties of the signal, amplitude and time. In these two dimensions, problems are more frequently caused by operator error than by malfunctioning equipment. Correction of amplitude and pulse width problems often simply involves proper adjustment of the equipment
the signal passes through.
Two kinds of amplitude measurements are important in television systems. Absolute levels, such as peak-to-peak amplitude, need to be properly adjusted.
The relationships between the parts of the signal are also important. The ratio of sync to the rest of the signal, for example, must be accurately maintained.
When setting video amplitudes, it is not sufficient to simply adjust the output level of the final piece of equipment in the signal path. Every piece of equipment should be adjusted to appropriately transfer the signal
from input to output. Television equipment is generally not designed to handle signals that deviate much from the nominal 1-volt peak-to-peak amplitude.
Signals which are too large can be clipped or distorted and signals which are too small will suffer from degraded signal-tonoise performance.
Video amplitudes are monitored and adjusted on a daily basis in most television facilities. Signal timing parameters are usually checked less fre q u e n t l y, however, it is still important to under - stand the measurement methods.
A periodic verification that all timing parameters are within limits is recommended.
This booklet does not address system timing issues which deal with relative time relationships between the many signals in a television facility. Although system timing is critical to production quality, it is outside the
scope of this publication. On the following pages, only those timing measurements that relate to a single signal are addressed.
Amplitude Measurements
DEFINITION
PAL composite video signals are nominally 1 volt peak-to-peak. Amplitude measurement techniques are used to verify that the signals conform to this nominal value and to make the appropriate gain adjustments
when needed. Similar methods of evaluating the waveform are used for both measurement and adjustment of signal levels. Measurements of the peak-topeak amplitude of the video signal are sometimes called “insertion gain” measurements.
PICTURE EFFECTS
Insertion gain errors cause the picture to appear too light or too dark. Because of the effects of ambient light, apparent colour saturation is also affected.
TEST SIGNAL
Insertion gain can be measured with any signal that contains a 700 mV white portion. Colour bars and pulse and bar signals are most frequently used (see Figures 5 and 6). Many of the standard ITS signals also contain a 700 mV bar and can be used to measure or adjust video gain.
MEASUREMENT METHODS
Waveform Monitor Graticule. Signal amplitude can be measured with a waveform monitor by comparing
the waveform to the vertical scale on the graticule. With the waveform monitor vertical gain in the calibrated setting (1 volt full scale), the signal should be 1 volt from sync tip to peak white (see Figure 7). The graticule in the VM700T WAVEFORM mode can be used in a similar manner.
Added Calibrator Method
Some waveform monitors have a feature that allows the internal calibrator signal to be used as a reference
for amplitude measurements.
This feature is known as WFM + CAL in the 1781R. In the 1481 it is accessed by depressing both the CAL button and the OPER buttons.
The WFM + CAL display consists of two video traces vertically offset by the calibrator amplitude.
This display is obtained by adding the incoming signal to a calibrated square wave of known amplitude. Signal amplitude is equal to the calibrator amplitude when the bottom of the upper trace and the top of the lower trace coincide.
The WFM + CAL mode is most commonly used to set insertion gain which requires a 1-volt calibrator signal. When using a 1781R, select a calibrator amplitude of 1000 mV. In the 1481R, the DC RESTORER setting determines which of two calibrator amplitudes is selected. The calibrator amplitude is 1 volt when
SYNC TIP is selected and 700 mV when BACK PORCH is selected.

Figure 5. 100.0.75.0 colour bars

.Figure 6. Pulse and bar test signal.

F i g u re 7. A 1-volt signal properly positioned with respect to the 1781R graticule.
and peak white of the lower trace coincide. Figure 8 shows a properly adjusted signal. Since the waveform monitor vertical gain need not be calibrated in this mode, the gain can be increased for greater resolution.
The 1781R has a variable amplitude calibrator so the WFM + CAL mode can be used to measure signal amplitudes other than 1 volt. Measurements are made by adjusting the calibrator amplitude (with the large front panel knob) until the bottom of the upper trace and the top of the lower trace coincide. At this
point the calibrator amplitude equals the signal amplitude and can be read from the screen. The example in Figure 9 shows the WFM + CAL mode being used to measure sync amplitude.
1781R Voltage Cursors.
Some waveform monitors, such as the 1781R, are equipped with ons c reen voltage cursors for making
accurate amplitude measurements.
Peak-to-peak amplitudecan be measured by positioning one cursor on sync tip and the other on peak white (see Figure 10). The 1781R vertical gain control affects the cursors and the waveform in the same manner so vertical gain can be increased to allow for more a c c urate positioning of the cursors.
When setting insertion gain, it may be convenient to first setthe cursor separation for 1000 mV. The video signal amplitude should than be adjusted to match the cursor amplitude.
VM700T Cursors.
Manual amplitude measurements can be made with the VM700T by selecting CURSORS in the WAVEFORM mode. The horizontal baseline in the middle of the screen is used as a reference. To measure peakto- peak amplitude, first position sync tip on the baseline. Touch the RESET DIFFS selection on
the screen to reset the voltage difference to zero. Now move the waveform down until the white bar is on the baseline and read the voltage difference from the screen.
NOTES
1. Sync to Picture Ratio. When the signal amplitude is wrong, it isimportant to verify that the problem is really a simple gain error rather than a distortion. This can be accomplished by checking the ratio of sync to the picture signal (the part of the signal above blanking), which should be 3:7.
If the ratio is cor rect, proceed with the gain adjustment. If the ratio is incorrect, there is a problem and further investigation is needed. The signal could be suffering from distortion, or equipment that re-inserts sync
and burst may be malfunctioning.
2. Sync & Burst Measurements.
Sync and burst should each be 30% of the composite video amplitude (300 millivolts for a 1-volt signal). Most of the methods discussed in this section can be used to measure sync and burst amplitudes. When using the 1781R voltage cursors, the TRACK mode is a convenient tool for comparing sync and burst amplitudes. In this mode, the separation between the two cursors remains fixed and they can be moved together with respect to the waveform.
3. Measurement Accuracy
In general, the added calibrator and voltage cursor methods are more accurate than the graticule technique.
However, some cursor implementations have far more resolution than accuracy, cre a t i n g an impression of measurements more precise than they really are. Familiarity with the specifications of the waveform monitor
and an understanding of theaccuracy and resolution available in the various modes will help make an appropriate choice.
4. Using the Luminance Filter.
When setting insertion gain with a live signal rather than a test signal, it may be useful to enable the luminance or lowpass filter on the waveform monitor. This filter removes the chrominance information so that peak white luminance levels can be used for setting gain.

Figure 8. The WFM + CAL mode in the 1781R indicates that insertion gain is properly adjusted.

F i g u re 9. The WFM + CAL mode can also be used to measure sync amplitude.

Figure 10. 1781R voltage cursors positioned to measure peak-to-peak amplitude.
Time Measurements
DEFINITION
Horizontal and vertical synchronization pulse widths are measured in order to verify that they fall within specified limits. Other synchronization parameters such as rise and fall times and the position and number of
cycles in burst are also specified and should occasionally be measured to verify compliance.
CCIR Report 624 is a widely accepted standard for PAL timing values and tolerances.
The CCIR horizontal timing information for PAL systems is reproduced in Figure 11.
PICTURE EFFECTS
Small errors in pulse widths will not affect picture quality.
However, if the errors become so large that the pulses cannot be properly processed (by equipment), picture breakup may occur.
TEST SIGNAL
Timing measurements can be made on any composite signal that contains horizontal, vertical and subcarrier (burst) synchronization information.
MEASUREMENT METHODS
Waveform Monitor Graticule.
Time intervals can be measured by comparing the waveform to the marks along the horizontal baseline of a waveform monitor graticule. In order to get adequate resolution, it is usually necessary to magnify the waveform display horizontally. Select the setting that provides as much magnification as possible while still keeping the interval of interest entirely on-screen. The scale factor, typically microseconds per major Division, changes with horizontal magnification. The 1781R displays the microseconds per division setting on the screen. For the 1481, time per division is obtained from the switch setting.

Figure 11. CCIR horizontal pulse width requirements.
F i g u re 12).
1781R Time Cursors.
Some waveform monitors and oscilloscopes are equipped with cursors to facilitate the measurement of time intervals. The time cursors in the 1781R appear as bright dots on the waveform, an implementation that allows for very accurate positioning on waveform transitions.To make a pulse width measurement, position the cursors on the 50% points of the transitions and read the cursor separation directly from the screen. An
example of a horizontal sync width measurement is shown in Figure 13. If necessary, use the vertical graticule scale to help locate the 50% points.
Alternatively, the voltage cursors in the RELATIVE mode can be used to locate the 50% points.
VM700T Cursors.
The cursors in the VM700T WAVEFORM mode can be used to make pulse width measurements. After establishing the 100% and 0% points of sync, the cursors can be moved to the 50% point to obtain a
time measurement (see Figure 14). Consult the manual for detailed instructions on how to use the cursors.

Figure 12. Horizontal sync width measurement at the 50% amplitude points.

Figure 13. The 1781R time cursors positioned to measure horizontal sync width at the 50% amplitude points.

Figure 14. The VM700T cursors can be used to make horizontal sync width measurements.
The H TIMING selection in the VM700T MEASURE menu displays all horizontal blanking interval timing measurements (see Figure 15). The AUTO mode also provides measurements of the individual parameters.
NOTES
5. Rise and Fall Time Measurements.
Many standards include specifications for the rise and fall time of the sync pulse (also referred to as buildup
time). These measurements are indicators of how fast the transitions occur and are typically made between the 10% and 90% points of the signal.
The methods used for measuring pulse widths can generally be applied to rise and fall times. However, for 10%-to-90% measurements, it is generally most convenient to use the waveform monitor variable gain control to normalize the pulse height to 500 or 1000 mV. The 10% and 90% points can then easily be
located with the graticule. In the 1781R RELATIVE mode, the voltage cursors can be used to locate the appropriate levels.
6. Checking the Vertical Interval.
The number of pulses in the vertical interval, as well as the widths of the equalizing pulses and vertical serrations, are also specified. CCIR nominal values and tolerances are shown in Figure 17. It is good practice to occasionally verify that all of these parameters are correct. The V Blank selection in the VM700T
MEASURE mode provides a convenient means of checking the format of the vertical interval and the timing of the individual pulses (see Figure 16).

Figure 15. The VM700T H Timing display.

Figure 16 The VM700T Vertical Blanking display.

Figure 17. CCIR vertical interval specifications.
SCH Phase
DEFINITION
SCH (SubCarrier to Horizontal) Phase refers to the timing relationship between the 50% point of the leading edge of sync and the zero crossings of the reference subcarrier. Errors are e x p ressed in degrees of subcarrier phase. The official EBU definition, taken from EBU Technical Statement D 23-1984 (E), is asfollows: “The subcarrier-to-line sync (Sc-H) phase is defined as the phase of the +E’u component of the colour burst extrapolated to the half-amplitude point of the leading edge of the synchronizing pulse of line 1 of field 1.” Since there is no burst on line 1, measurement of SCH phase on line 7 of field 1 has become the
generally accepted convention. Target tolerances of ± 20 degrees have been established although, in practice, much tighter tolerances are generally maintained.
Modern facilities often try to ensure that SCH phase errors do not exceed a few degrees.
PICTURE EFFECTS
SCH phase becomes important only when television signals from two or more sources are combined or sequentially switched. In order to ensure that horizontal jumps do not occur when a switch is made, the sync
edges of the two signals must be accurately timed and the phase of colour burst matched. Since both sync and subcarrier are continuous signals with a fixed relationship to one another, it is possible to simultaneously
achieve both timing conditions only if the two signals have the same SCH phase relationship.
Because of the complex relationship between the sync and subcarrier frequencies, the exact SCH phase relationship for a given line repeats itself only once every eight fields (see Note 7). In order to achieve the sync and burst timing conditions required for a clean switch between two signals, the eightfield sequence of the signals must be properly lined up (i.e. Field 1 of Signal A and Field 1 of Signal B must occur at the
same time). When this condition is achieved, the two signals are said to be ""colour framed''. It is important to remember that colour framing is inextricably tied to other system timing parameters and is by no means an
independent variable. Only if two signals have the same SCH phase relationship and are properly colour framed can the sync timing and burst phase matching requirements be achieved.
Since signals must have the same SCH phase relationship in order to be cleanly combined, standardization on one value of SCH phase will clearly facilitate the transfer of programme material.
This is one reason for trying to maintain 0 degrees of SCH phase error. Another motivation for keeping SCH phase within reasonable limits is that various pieces of equipment need to be able to distinguish between the
colour frames in order to process the signal properly. This cannot be done accurately if the SCH
phase is allowed to approach 90 degrees.
TEST SIGNALS
SCH phase measurements can be made on any signal with both sync and colour burst present.
MEASUREMENT METHODS
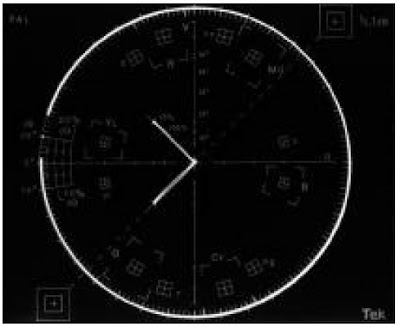
Polar Display. Some instruments, such as the 1781R, are equipped with a polar SCH display that consists of the two burst vectors and a dot representing the phase of sync. The dot is in the centre of a "window'' in the large circle that appears as part of the display (see Figure 18). This circle is a result of the 25 Hertz offset
(see Note 7) which changes the SCH phase from line to line. The circle itself contains no relevant information. The SCH phase is 0 degrees when the dot is at an angle midway between the two bursts. If
there is an SCH phase error, its magnitude can be determined by measuring the angle between the sync dot and the midway point of the two bursts. The graticule can be used for this purpose when the bursts are properly positioned on their +135 and -135 degree points. The precision phase shifter in the 1781R can also be used to quantify the error.
The 1781R must be internally referenced to measure the SCH phase of a single signal. Sync and burst of the selected signal are compared to each other in this mode. When external reference is selected, both burst and
sync of the selected signal are displayed relative to burst of the external reference signal. This display allows determination of whether or not two signals are colour framed. Assuming that both the reference signal and the selected signal have no SCH phase error, the sync dot will be between the burst vectors if the signals are colour framed and 180 degrees away when they are not.
VM700T Automatic Measurement.
Select SCH PHASE in the VM700T MEASURE menu to obtain a polar display of SCH phase (see Figure 19). The vector in this display directly repr esents SCH phase error (there are not separate vector representations of sync and burst). The dual SCH display provides a simultaneous view of the SCH vectors for two signals. The full field SCH display provides a field-rate display that plots the SCH phase of each line in the field.

Figure 18. The 1781R polar SCH phase display showing a 10 degree error.

Figure 19. The VM700T SCH Phase Measurement display.
NOTES
7. The PAL Eight-Field Sequence.
The eight-field sequence exists in PAL because of the relationships between the line, field and subcarrier frequencies.
Remember that subcarrier and H sync can be thought of as two continuous signals with a fixed relationship to one another.
This relationship is defined mathematically as: Fs c = (1135/4 X Fh) + 25 which yields a subcarrier frequency (Fsc) of 4,433,618.75 Hz for a line frequency (Fh) of 15,625 Hz. It can be seen from the equation that there are an odd number of subcarrier quarter-cycles in a line. This implies that SCH phase changes by 90 degrees every line.
Since there are also an odd number of lines in a frame, the exact phase relationship between sync and burst for a given line repeats only once every eight fields (four frames).
Due to the 25 Hz offset, which is added to interleave chrominance dot patterns in the picture, the line-to-line change in SCH phase is actually somewhat more than 90 degrees. Keep this in mind when making measurements, as this is why SCH phase is defined on a given line in PAL. It is i m p o rtant to remember, however, that the existence of the eightfield sequence is determined only by the sync-to-subcarrier relationship and is independent of the 25 Hertz offset, the Bruch blanking sequence, and the alternate-line V-axis inversion.
8. For More Information.
For a comprehensive discussion of SCH phase and colour framing issues, see Tektronix Application Note (20W-5614-1), “Measuring and Monitoring SCH Phase with the 1751A Waveform/Vector Monitor”
Lihat juga
Table of Contents
|
|
3
|
4
| |
4
| |
6
| |
6
| |
8
| |
8
| |
8
| |
8
| |
9
| |
9
| |
10
| |
12
| |
15
| |
18
| |
19
| |
24
| |
26
| |
28
| |
30
| |
31
| |
36
| |
38
| |
41
| |
42
| |
46
| |
50
| |
5 2
| |
5 3
| |
54
| |
55
| |
56
| |
57
| |
58
| |
6 0
| |
61
| |
63
| |
64
| |
APPENDICES
| |
67
| |
Tidak ada komentar:
Posting Komentar