Frequency Response
DEFINITION
Frequency response measurements evaluate a system's ability to uniformly transfer signal components of different frequencies without affecting their amplitudes.
This parameter, also known as gain/frequency distortion or amplitude versus frequency response, evaluates the system's amplitude response over the entire video spectrum.
The amplitude variation may be expressed in dB or percent. The reference amplitude (0 dB, 100%) is typically the white bar or some low frequency.
Frequency response numbers are only meaningful if they contain three pieces of information: the measured amplitude, the frequency at which the measurement was made, and the reference frequency.
PICTURE EFFECTS
F requency response problems can cause a wide variety of aberrations in the picture, including all of the effects discussed in the sections on short time, line time, field time, and long time distortions.
TEST SIGNALS
Frequency response can be measured with a number of different test signals. Since there are significant differences between these signals, each one is discussed in some detail in this section.
Some test signals are available either as full-amplitude or reduced-amplitude signals. It is generally good practice to make measurements with both as the presence of amplitude nonlinearities in the system will have
greater effect on measurements made with full amplitude signals.
Multiburst.
The multiburst signal typically includes six packets of discrete frequencies that fall within the TV passband. The packet frequencies usually range from 0.5 MHz to 5.8 MHz with frequency increasing toward the right side of each line (see Figure 39). This signal is useful for a quick approximation of system frequency response and can be used on an in-service basis as a vertical interval test signal.

The multipulse signal is made up of modulated 20T and 10T sine-squared pulses with high-frequency components at various frequencies of interest, generally from 0.5 MHz to 5.8 MHz (see Figure 40). This signal can also be inserted in the vertical interval.

Modulated sine-squared pulses, which are also used to measure chrominance-to-luminance gain and delay errors, are discussed in the Chro m i n a n c e - t o - L u m i n a n c e Gain and Delay section of this book. Although different highfrequency components are used in the multipulse, the same principles apply. Bowing of the baseline indicates an amplitude error between the low-frequency and high-frequency components of
that pulse. Unlike the multiburst, the multipulse allows evaluation of group delay errors as well as amplitude errors.
Sweep Signal.
It is sometimes recommended that line-rate or field-rate sweep signals be used for measuring frequency
response. In a sweep signal, the frequency of the sine wave is continuously increased over the interval of a line or field.
An example of a sweep signal is shown in Figure 41. The markers indicate 1 MHz frequency intervals.
A sweep signal allows examination of frequency response continuously over the interval of interest rather than only at the discrete frequencies of the multi burst and multipulse signals.
This can be important for detailed characterization of a system, but does not offer any significant advantages in routine testing. While the other signals discussed here can be used in the vertical interval and ther efore
permit in-service testing, field-rate sweep signals can only be used on an out-of-service basis.

The (sin x)/x is a signal which has equal energy present at all harmonics of the horizontal scan frequency up to its cutoff frequency (see Figures 42 and 47). The (sin x)/x signal is primarily designed for use with a spectrum analyzer or an automatic measurement set such as the VM700T. Very little information is discernible in a time domain display.

Since each signal requires a different measurement method, separate discussions for the various test signals are presented in this section. The first three signals (multiburst, multipulse, and sweep) can all be measured with a waveform monitor using either the graticule or the voltage cursors to quantify the distortion. Measurement results are expressed in dB.
Waveform Monitor — Multiburst.
Frequency response measurements are made with the multiburst signal by measuring the peak-to-peak amplitudes of the packets. The low-frequency square wave at the beginning of the line should be used as the
amplitude reference.
Figures 43 and 44 show the 1781R voltage cursors being used to measure a frequency response distortion of 3.59 dB at 5.8 MHz. The error in dB is calculated as follows: 20 log10 (274/414) = -3.59 dB
In the RELATIVE mode, the 1781R's voltage cursors will provide results directly in dB.
Waveform Monitor — Multipulse.
Frequency response distortion shows up in the multipulse signal as bowing of the pulse baseline (see Figure 45). Distortions are quantified by measuring the amount of baseline displacement in the pulse of interest. It is
often easy to see which pulse exhibits the largest gain inequality so an overall result can be obtained by measuring that pulse only.
This measurement can be made by using a waveform monitor graticule to measure the baseline distortion and then transferring the numbers for each pulse to a nomograph. The nomograph for chrominance-to-luminance gain and delay measurements (see Figure 23) can also be used for multipulse measurements. Be sure to normalize each pulse height to 100% before making a measurement. Remember that the nomograph is intended for a 20T pulse measurements. When using a 10T pulse, the nomograph delay number must be
divided by two.
When only gain distortion is present, there will be a single peak in the pulse baseline. A value of zero is therefore applied to one axis of the nomograph. If group delay distortion is also present, the baseline distortion will be sinusoidal rather than a single peak. In this case, measure both lobes and apply the two numbers to the nomograph.
This will yield correct frequency response results as well as a group delay measurement.
The CHROMA/LUMA selection in the 1781R MEASURE menu can be used to make frequency response measurements with the multipulse signal. Repeat the cursor measurement procedure for the pulse corresponding to each frequency of interest.
If the system is relatively free of nonlinearity, it is also possible to estimate the amplitude error without using a nomograph.
Normalize the white bar to 100% and then measure either the amount of baseline bowing or the displacement of the pulse top from the white bar (the two numbers will be equal in a linear system). The amplitude error, in percent, is approximately equal to two times either value. This method yields valid results even in the presence of some delay error which is indicated by asymmetrical baseline distortion.
When delay error exceeds 150 nanoseconds, this method is not recommended.


Waveform Monitor — Sweep Signal.
Amplitude variations can be measured directly from a timedomain display when a sweep signal is used. Be sure to select a field-rate display on the waveform monitor when using a field sweep. Establish a reference at
some low frequency and measure the peak-to-peak amplitude at other frequencies of interest (see Figure 46).

Frequency response testing with the (sin x)/x signal is done with a spectrum analyzer. Attenuation or peaking of the flat portion of the spectral display can be read directly from the analyzer display in dB (see Figure 47).
In a time domain display, high frequency roll off will reduce the pulse amplitude and the amplitude of the pulse lobes. It is difficult, however, to quantify the error. The presence of amplitude nonlinearity in the system will cause asymmetrical distortion of the positive and negative pulses.

VM700T Automatic Measurement
The VM700T provides amplitude versus frequency response information for either the multiburst or (sin x)/x signal. Select MULTIBURST or GROUP DELAY (SIN X)/X in the MEASURE mode. Multiburst
measurements are also available in the AUTO mode.

13. Multipulse and Nonlinear Distortions.
When using the multipulse signal, the system under test must be reasonably free of nonlinearity. Distortions such as differential phase and gain can cause erroneous readings of both frequency response and group delay.

14. More Information.
Further information on frequency response testing is available in Tektronix application note (25W-11149-0), “Frequency Response Testing Using a (Sin x)/x Test Signal and the VM700A/T Video Measurement Set”
Lihat juga
Table of Contents
DEFINITION
Frequency response measurements evaluate a system's ability to uniformly transfer signal components of different frequencies without affecting their amplitudes.
This parameter, also known as gain/frequency distortion or amplitude versus frequency response, evaluates the system's amplitude response over the entire video spectrum.
The amplitude variation may be expressed in dB or percent. The reference amplitude (0 dB, 100%) is typically the white bar or some low frequency.
Frequency response numbers are only meaningful if they contain three pieces of information: the measured amplitude, the frequency at which the measurement was made, and the reference frequency.
PICTURE EFFECTS
F requency response problems can cause a wide variety of aberrations in the picture, including all of the effects discussed in the sections on short time, line time, field time, and long time distortions.
TEST SIGNALS
Frequency response can be measured with a number of different test signals. Since there are significant differences between these signals, each one is discussed in some detail in this section.
Some test signals are available either as full-amplitude or reduced-amplitude signals. It is generally good practice to make measurements with both as the presence of amplitude nonlinearities in the system will have
greater effect on measurements made with full amplitude signals.
Multiburst.
The multiburst signal typically includes six packets of discrete frequencies that fall within the TV passband. The packet frequencies usually range from 0.5 MHz to 5.8 MHz with frequency increasing toward the right side of each line (see Figure 39). This signal is useful for a quick approximation of system frequency response and can be used on an in-service basis as a vertical interval test signal.

Figure 39. A multiburst test signal.
Multipulse.The multipulse signal is made up of modulated 20T and 10T sine-squared pulses with high-frequency components at various frequencies of interest, generally from 0.5 MHz to 5.8 MHz (see Figure 40). This signal can also be inserted in the vertical interval.

Figure 40. The multipulse test signal.
Modulated sine-squared pulses, which are also used to measure chrominance-to-luminance gain and delay errors, are discussed in the Chro m i n a n c e - t o - L u m i n a n c e Gain and Delay section of this book. Although different highfrequency components are used in the multipulse, the same principles apply. Bowing of the baseline indicates an amplitude error between the low-frequency and high-frequency components of
that pulse. Unlike the multiburst, the multipulse allows evaluation of group delay errors as well as amplitude errors.
Sweep Signal.
It is sometimes recommended that line-rate or field-rate sweep signals be used for measuring frequency
response. In a sweep signal, the frequency of the sine wave is continuously increased over the interval of a line or field.
An example of a sweep signal is shown in Figure 41. The markers indicate 1 MHz frequency intervals.
A sweep signal allows examination of frequency response continuously over the interval of interest rather than only at the discrete frequencies of the multi burst and multipulse signals.
This can be important for detailed characterization of a system, but does not offer any significant advantages in routine testing. While the other signals discussed here can be used in the vertical interval and ther efore
permit in-service testing, field-rate sweep signals can only be used on an out-of-service basis.
Figure 41. A 6 MHz field-rate sweep signal with markers (2-field display).
(Sin x)/x.The (sin x)/x is a signal which has equal energy present at all harmonics of the horizontal scan frequency up to its cutoff frequency (see Figures 42 and 47). The (sin x)/x signal is primarily designed for use with a spectrum analyzer or an automatic measurement set such as the VM700T. Very little information is discernible in a time domain display.

Figure 42. A time domain display of the (sin x)/x signal.
MEASUREMENT METHODSSince each signal requires a different measurement method, separate discussions for the various test signals are presented in this section. The first three signals (multiburst, multipulse, and sweep) can all be measured with a waveform monitor using either the graticule or the voltage cursors to quantify the distortion. Measurement results are expressed in dB.
Waveform Monitor — Multiburst.
Frequency response measurements are made with the multiburst signal by measuring the peak-to-peak amplitudes of the packets. The low-frequency square wave at the beginning of the line should be used as the
amplitude reference.
Figures 43 and 44 show the 1781R voltage cursors being used to measure a frequency response distortion of 3.59 dB at 5.8 MHz. The error in dB is calculated as follows: 20 log10 (274/414) = -3.59 dB
In the RELATIVE mode, the 1781R's voltage cursors will provide results directly in dB.
Waveform Monitor — Multipulse.
Frequency response distortion shows up in the multipulse signal as bowing of the pulse baseline (see Figure 45). Distortions are quantified by measuring the amount of baseline displacement in the pulse of interest. It is
often easy to see which pulse exhibits the largest gain inequality so an overall result can be obtained by measuring that pulse only.
This measurement can be made by using a waveform monitor graticule to measure the baseline distortion and then transferring the numbers for each pulse to a nomograph. The nomograph for chrominance-to-luminance gain and delay measurements (see Figure 23) can also be used for multipulse measurements. Be sure to normalize each pulse height to 100% before making a measurement. Remember that the nomograph is intended for a 20T pulse measurements. When using a 10T pulse, the nomograph delay number must be
divided by two.
When only gain distortion is present, there will be a single peak in the pulse baseline. A value of zero is therefore applied to one axis of the nomograph. If group delay distortion is also present, the baseline distortion will be sinusoidal rather than a single peak. In this case, measure both lobes and apply the two numbers to the nomograph.
This will yield correct frequency response results as well as a group delay measurement.
The CHROMA/LUMA selection in the 1781R MEASURE menu can be used to make frequency response measurements with the multipulse signal. Repeat the cursor measurement procedure for the pulse corresponding to each frequency of interest.
If the system is relatively free of nonlinearity, it is also possible to estimate the amplitude error without using a nomograph.
Normalize the white bar to 100% and then measure either the amount of baseline bowing or the displacement of the pulse top from the white bar (the two numbers will be equal in a linear system). The amplitude error, in percent, is approximately equal to two times either value. This method yields valid results even in the presence of some delay error which is indicated by asymmetrical baseline distortion.
When delay error exceeds 150 nanoseconds, this method is not recommended.

Figure 43. The low-frequency square wave is defined as the reference.

F i g u re 44. The peak-to-peak amplitude of the smallest packet is then measure d .

Figure 45. The multipulse signal exhibiting frequency response distortion.
Waveform Monitor — Sweep Signal.
Amplitude variations can be measured directly from a timedomain display when a sweep signal is used. Be sure to select a field-rate display on the waveform monitor when using a field sweep. Establish a reference at
some low frequency and measure the peak-to-peak amplitude at other frequencies of interest (see Figure 46).
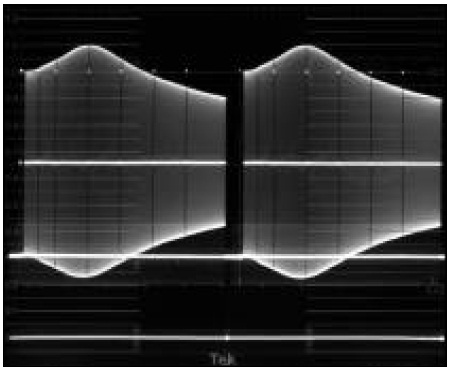
Figure 46. A sweep signal showing frequency response distortion.
Spectrum Analyzer — (Sin x)/x.Frequency response testing with the (sin x)/x signal is done with a spectrum analyzer. Attenuation or peaking of the flat portion of the spectral display can be read directly from the analyzer display in dB (see Figure 47).
In a time domain display, high frequency roll off will reduce the pulse amplitude and the amplitude of the pulse lobes. It is difficult, however, to quantify the error. The presence of amplitude nonlinearity in the system will cause asymmetrical distortion of the positive and negative pulses.
Figure 47. A spectrum analyzer display of a (sin x)/x signal with a cutoff frequency of 6 MHz.
VM700T Automatic Measurement
The VM700T provides amplitude versus frequency response information for either the multiburst or (sin x)/x signal. Select MULTIBURST or GROUP DELAY (SIN X)/X in the MEASURE mode. Multiburst
measurements are also available in the AUTO mode.
Figure 48. The VM700T Multiburst measurement.
Notes13. Multipulse and Nonlinear Distortions.
When using the multipulse signal, the system under test must be reasonably free of nonlinearity. Distortions such as differential phase and gain can cause erroneous readings of both frequency response and group delay.
Figure 49. The VM700T Group Delay & Gain measurement made with the (sin x)/x signal.
14. More Information.
Further information on frequency response testing is available in Tektronix application note (25W-11149-0), “Frequency Response Testing Using a (Sin x)/x Test Signal and the VM700A/T Video Measurement Set”
Lihat juga
Table of Contents
|
|
3
|
4
| |
4
| |
6
| |
6
| |
8
| |
8
| |
8
| |
8
| |
9
| |
9
| |
10
| |
12
| |
15
| |
18
| |
19
| |
24
| |
26
| |
28
| |
30
| |
31
| |
36
| |
38
| |
41
| |
42
| |
46
| |
50
| |
5 2
| |
5 3
| |
54
| |
55
| |
56
| |
57
| |
58
| |
6 0
| |
61
| |
63
| |
64
| |
APPENDICES
| |
67
| |
Tidak ada komentar:
Posting Komentar